Hypothesis Testing Procedure

Audio Brief
Show transcript
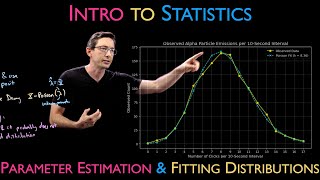
This episode outlines the fundamentals of hypothesis testing, a statistical method for determining if a significant change has occurred.
There are four key takeaways from this discussion on statistical hypothesis testing.
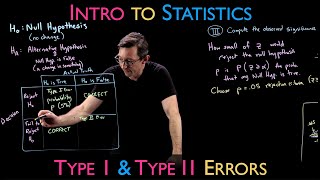
First, always begin a test by framing your question with a null hypothesis, assuming no change, and an alternative hypothesis, proposing a change. The null hypothesis is the default assumption to be challenged by evidence.
Second, calculate a test statistic like the Z-score. This value quantifies how far your observed sample statistic deviates from the expected value under the null hypothesis, with larger Z-scores indicating more extreme results.
Third, interpret the p-value. This is the probability your observed result occurred purely by random chance if the null hypothesis were true. A small p-value, typically under 0.05, signals statistical significance, allowing rejection of the null hypothesis.
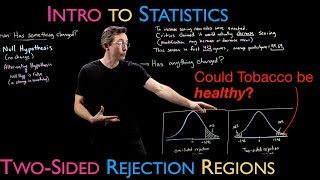
Fourth, ensure statistical integrity by pre-determining your significance level, such as p equals 0.05, and choosing between a one-tailed or two-tailed test before data analysis. One-tailed tests look for directional changes, while two-tailed tests detect any change.
Mastering hypothesis testing provides a robust, evidence-based framework for informed decision-making across various fields.
Episode Overview
- Provides a foundational understanding of hypothesis testing, a statistical method used to determine if a significant change has occurred.
- Defines the core components: the null hypothesis (H₀), which assumes no change, and the alternative hypothesis (Hₐ), which proposes a change.
- Walks through the standard procedure for conducting a hypothesis test, including calculating a test statistic (Z-score) and interpreting the resulting p-value.
- Explains the concept of statistical significance, the role of the p-value, and how to use it to decide whether to reject the null hypothesis.
- Introduces the difference between one-tailed and two-tailed tests, depending on whether the hypothesis specifies the direction of the change.
Key Concepts
- Hypothesis Testing: A formal procedure for investigating ideas about the world using statistics. It's used to determine whether an observed outcome is statistically significant or simply due to random chance.
- Null Hypothesis (H₀): The default assumption that there is no effect or no difference between groups. The goal of the test is to collect enough evidence to reject this hypothesis.
- Alternative Hypothesis (Hₐ): The hypothesis that a change has occurred. This is what the researcher is typically trying to prove.
- Test Statistic (Z-score): A standardized value that measures how far an observed sample statistic (like the sample mean) is from the expected value under the null hypothesis. The formula given is
Z = (Observed Average - Expected Average) / Standard Error. - P-value (Observed Significance Level): The probability of observing a result as extreme as, or more extreme than, the one measured, assuming the null hypothesis is true. A small p-value (e.g., < 0.05) suggests the observed result is unlikely to be due to chance alone.
- Rejection Region: A pre-defined range for the test statistic. If the calculated Z-score falls within this region, it provides sufficient evidence to reject the null hypothesis. The size of this region is determined by the chosen significance level (p-value cutoff).
- One-Tailed vs. Two-Tailed Test: A one-tailed test is used when testing for a change in a specific direction (e.g., an increase in website traffic). A two-tailed test is used when testing for any change, whether it's an increase or a decrease.
Quotes
- At 00:56 - "Your null hypothesis would be that there is no change in the treatment group having the drug." - Explaining the concept of the null hypothesis using a clear, practical example of a medical drug trial.
- At 01:44 - "You assume the null hypothesis is true." - Stating the foundational first step of the entire hypothesis testing procedure.
- At 06:54 - "P is the probability that my null hypothesis is true." - Providing a simple, intuitive definition of the p-value and its role in decision-making.
Takeaways
- Always start a statistical test by framing your question with a null hypothesis (H₀: "nothing changed") and an alternative hypothesis (Hₐ: "something changed").
- Calculate a test statistic, like the Z-score, to quantify how many standard units your observation is from the expected baseline. A larger Z-score indicates a more extreme result.
- The p-value is the probability that your observed result happened purely by random chance. A small p-value (e.g., less than 0.05) means the result is statistically significant, allowing you to reject the null hypothesis.
- To maintain statistical integrity, you must choose your significance level (e.g., p = 0.05) before you run the experiment and analyze the data.
- Determine if your hypothesis requires a one-tailed test (if you expect change in one direction) or a two-tailed test (if a change in either direction is relevant). This choice affects how you define your rejection region.