Hypothesis Testing: Type I and Type II Errors

Audio Brief
Show transcript
This episode covers hypothesis testing, a foundational statistical method for determining if observed changes are statistically significant or merely due to random chance.
There are three key takeaways. First, hypothesis testing starts by assuming no effect, the null hypothesis, and then challenges it with data. Second, the p-value quantifies the likelihood of observed results occurring by chance, with a low p-value indicating significance. Third, understand Type I and Type II errors: false positives and false negatives, respectively, which represent risks in drawing conclusions.
Hypothesis testing formally begins by establishing a null hypothesis, which posits no effect or change. This is the baseline assumption challenged by the data. An alternative hypothesis proposes that a statistically significant change or effect exists.
A crucial metric is the p-value, which represents the probability of observing the data, or more extreme results, if the null hypothesis were true. A small p-value, typically below 0.05, suggests the observed data is unlikely under the null hypothesis, providing evidence to reject it.
Type I errors, or false positives, occur when a true null hypothesis is mistakenly rejected. The probability of this error equals the chosen significance level, often the p-value. Conversely, Type II errors are false negatives, where a real effect is missed because the false null hypothesis is not rejected.
Mastering these concepts is crucial for making robust, data-driven decisions and avoiding misinterpretations of statistical evidence.
Episode Overview
- This episode provides a foundational overview of hypothesis testing, a formal statistical method used to determine if an observed change is statistically significant or simply due to random chance.
- The instructor breaks down the core components, including the null hypothesis (no change) and the alternative hypothesis (a change occurred), using examples like testing a new drug.
- The step-by-step procedure for conducting a hypothesis test is explained, focusing on assuming the null hypothesis, defining a test statistic (Z-score), and calculating a p-value.
- The concepts of Type I and Type II errors are introduced, clarifying the risks of making incorrect conclusions (false positives and false negatives) based on statistical results.
Key Concepts
- Null Hypothesis (H₀): The default assumption that there is no change or no effect. It's the "straw man" hypothesis that the statistical test aims to disprove.
- Alternative Hypothesis (Hₐ): The hypothesis that there is a statistically significant change or effect. This is what you might accept if you have enough evidence to reject the null hypothesis.
- Test Statistic (Z-score): A calculated value that measures how many standard errors an observed sample mean is from the expected mean under the null hypothesis. A larger Z-score indicates a more extreme observation.
- Significance Level (p-value): The probability of observing your data (or something more extreme) if the null hypothesis were actually true. A small p-value (e.g., < 0.05) suggests that the observed data is unlikely under the null hypothesis.
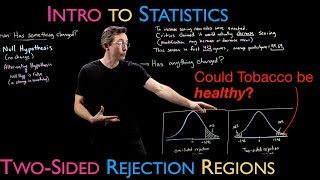
- Rejection Region: A range of values for the test statistic. If the calculated test statistic falls into this region, you reject the null hypothesis. The size of this region is determined by the chosen p-value.
- Type I Error (False Positive): The error of rejecting the null hypothesis when it is actually true. The probability of making a Type I error is equal to the p-value.
- Type II Error (False Negative): The error of failing to reject the null hypothesis when it is actually false. The probability is denoted by beta (β).
Quotes
- At 01:08 - "And you set up a straw man or a dummy hypothesis called the null hypothesis." - Explaining that the null hypothesis is created specifically to be challenged by the data.
- At 01:57 - "That gives you some measure of how likely or unlikely it is to observe this data, assuming the null hypothesis that it came from this distribution." - Describing the purpose of the test statistic (Z-score) in evaluating the evidence against the null hypothesis.
- At 05:47 - "A Type I error is where H-nought is actually true... but you falsely rejected the null hypothesis." - Providing a clear definition of a Type I error, also known as a false positive.
Takeaways
- Hypothesis testing begins by assuming the "no change" scenario (the null hypothesis) is true and then uses data to see if that assumption is unlikely.
- The p-value is a critical metric that quantifies the probability that your observed results occurred by random chance alone. A common threshold for statistical significance is a p-value of less than 0.05.
- When you reject the null hypothesis, you are concluding that a real effect exists, but there is always a risk that you are wrong. This risk of a "false positive" is known as a Type I error, and its probability is equal to your chosen p-value.
- A Type II error, or "false negative," occurs when you fail to detect an effect that is actually present. Designing a powerful test involves minimizing the probability of both Type I and Type II errors.