Hypothesis Testing in Statistics

Audio Brief
Show transcript
This episode covers hypothesis testing, a fundamental statistical concept for determining if a meaningful change has occurred in data.
There are four key takeaways from this discussion. First, hypothesis testing provides a formal procedure to assess if observed data changes are statistically significant or merely due to random chance. Second, the process begins by establishing a null hypothesis, assuming no change or effect, then calculating the probability of current observations if this assumption were true. Third, a small p-value, typically below 0.05, suggests observed data is highly unlikely under the null, leading to its rejection in favor of a real change. Fourth, test statistics, such as Z-scores, quantify observed versus expected differences in standard errors, which is essential for determining the p-value.
Hypothesis testing is a statistical method to test claims about population parameters using data from a sample. Its central question is always "Has something changed?" This method is often applied in experimental setups comparing a control group to a treatment group to assess the statistical significance of an intervention's effect.
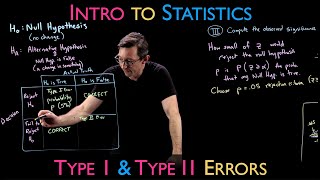
The null hypothesis, H₀, represents the default assumption that there is no change, effect, or difference within the data; any observed variation is attributed solely to random chance. Conversely, the alternative hypothesis, Hₐ, directly contradicts H₀, proposing that a real, statistically significant change or effect exists.
The p-value represents the probability of observing a result as extreme as, or more extreme than, the one actually observed, assuming the null hypothesis is true. A sufficiently small p-value provides strong evidence against the null hypothesis, prompting its rejection and supporting the alternative hypothesis.
A test statistic, such as a Z-score, is a value calculated from sample data that measures how many standard errors the observed sample mean deviates from the expected population mean under the null hypothesis. This quantification of deviation, often informed by principles like the Central Limit Theorem, is crucial for determining the p-value and assessing statistical significance.
Understanding these core components of hypothesis testing is crucial for making informed, data-driven decisions across various analytical and scientific fields.
Episode Overview
- An introduction to the fundamental statistical concept of hypothesis testing, which is used to determine if a change has occurred in a data set.
- A breakdown of the core components of hypothesis testing, including the null hypothesis, alternative hypothesis, test statistic, and p-value.
- A practical example is used to illustrate the entire process, from setting up the problem to calculating the test statistic and interpreting the result.
- The episode explains how to use the Central Limit Theorem to determine the likelihood that an observed change is statistically significant rather than due to random fluctuation.
Key Concepts
- Hypothesis Testing: A statistical method to test a claim or hypothesis about a parameter in a population, using data measured in a sample. The central question it answers is "Has something changed?"
- Control vs. Treatment Group: A common experimental setup where a control group receives no intervention, and a treatment group does. Hypothesis testing compares the outcomes to see if the treatment had a statistically significant effect.
- Null Hypothesis (H₀): The default assumption that there is no change, effect, or difference. Any observed variation is attributed to random chance or statistical fluctuation.
- Alternative Hypothesis (Hₐ): The hypothesis that contradicts the null hypothesis, stating that there is a real, statistically significant change or effect.
- Test Statistic (Z-score): A value calculated from sample data that measures how many standard errors the observed sample mean is from the expected population mean (under the null hypothesis).
- p-value: The probability of observing a result as extreme as, or more extreme than, the one actually observed, assuming the null hypothesis is true. A small p-value is evidence against the null hypothesis.
Quotes
- At 01:38 - "Has something changed in my distribution of my data?" - The speaker summarizing the fundamental question that hypothesis testing aims to answer.
- At 06:14 - "There is what's called the null hypothesis that nothing changed." - A simple and direct definition of the null hypothesis, the starting point for any statistical test.
- At 23:06 - "If your p-value is small enough... then you say that you reject the null hypothesis." - Explaining the core decision-making rule based on the calculated p-value to determine if a result is statistically significant.
Takeaways
- Hypothesis testing provides a formal procedure to determine if an observed change in data is significant or simply due to random chance.
- The process starts by assuming the "boring" outcome—that nothing has changed (the null hypothesis)—and then calculating the probability of seeing your data if that assumption were true.
- A small p-value (e.g., less than 0.05) indicates that your observation is highly unlikely under the null hypothesis, allowing you to reject it in favor of the alternative hypothesis (that a real change has occurred).
- The test statistic (like a Z-score) helps quantify the difference between what you observed and what you expected, measured in terms of standard errors, which is crucial for determining the p-value.