But what is the Fourier Transform? A visual introduction.

Audio Brief
Show transcript
This episode provides an intuitive introduction to the Fourier transform, a fundamental concept in mathematics and signal processing.
There are four key takeaways from this discussion. First, the Fourier transform converts a signal from the time domain into the frequency domain. Second, a powerful visual analogy involves "winding" a signal's graph around a circle to identify frequencies. Third, distinct spikes in a Fourier transform plot indicate strong components of a specific frequency. Finally, this mathematical tool has practical applications, such as in sound editing.
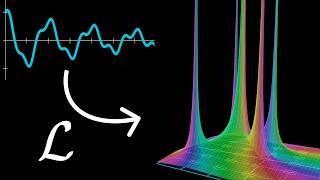
The Fourier transform is a mathematical operation that transforms a signal, like a sound wave, from how it changes over time to what pure frequencies it is composed of. It essentially breaks down a complex signal into its constituent simple sine waves.
Visualizing this process involves a "winding machine" where a signal's graph is wrapped around a circle at different winding frequencies. When the winding frequency matches a component frequency present in the original signal, the wound graph becomes noticeably lopsided. This movement of its center of mass highlights the presence and strength of that particular frequency.
The output of the Fourier transform is a new plot that graphs the strength of these identified frequencies. Distinct "spikes" on this plot directly correspond to strong frequency components within the original signal. This plot effectively provides a spectral fingerprint of the signal.
This powerful mathematical tool has significant practical applications. For instance, in sound editing, it can be used to isolate and remove specific unwanted frequencies, like a hum, or enhance certain musical notes within a recording, offering precise control over audio composition.
In summary, the Fourier transform is an indispensable tool for understanding the frequency components of complex signals across various scientific and engineering disciplines.
Episode Overview
- This episode provides a visual and intuitive introduction to the Fourier transform, a fundamental concept in mathematics and signal processing.
- The core idea is explained using a powerful analogy of "winding" a signal's graph around a circle to see how different frequencies resonate.
- The video builds from this visual "winding machine" to the formal mathematical definition of the Fourier transform using complex numbers and integrals.
- It demonstrates how the transform can be used to decompose a complex signal, like a sound wave made of multiple notes, into its constituent pure frequencies.
Key Concepts
- Frequency Decomposition: The process of breaking down a complex signal into the simple, pure sine waves (frequencies) that compose it, much like unmixing colors.
- The Winding Machine: A visual analogy where a signal's graph is wrapped around a circle at a specific "winding frequency." The shape of this wound graph reveals information about the frequencies present in the signal.
- Center of Mass: The key metric of the wound-up graph. When the winding frequency matches a frequency present in the original signal, the wound shape becomes lopsided, and its center of mass moves significantly away from the origin.
- The Fourier Transform Plot: A new graph that plots the position of the center of mass (representing frequency strength) for every possible winding frequency. This plot shows distinct "spikes" at the frequencies that make up the original signal.
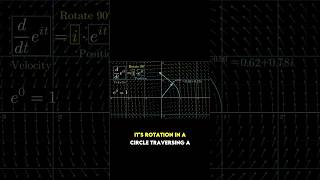
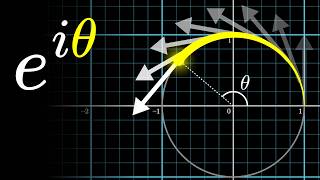
- Complex Numbers & Euler's Formula: The mathematical language used to precisely describe the rotational "winding" process. The expression
e^(-2πift)represents a point rotating clockwise on the complex plane at a frequencyf. - Integral as Center of Mass: The formal Fourier transform formula is an integral that calculates the center of mass of the wound-up graph over the entire duration of the signal.
Quotes
- At 00:09 - "A certain animated approach to thinking about a super important idea from math, the Fourier transform." - The speaker introduces the video's goal of providing an intuitive, visual explanation for a complex mathematical tool.
- At 02:56 - "The key idea is going to be to take this graph and sort of wrap it up around a circle." - This quote introduces the central analogy of the "winding machine," which forms the basis for the entire visual explanation.
- At 17:58 - "And all of this is encapsulated inside that formula that we built up." - The speaker connects the final, formal integral formula for the Fourier transform directly back to the visual intuition of the winding graph and its center of mass.
Takeaways
- The Fourier transform is a mathematical tool that converts a signal from the time domain (how it changes over time) into the frequency domain (what frequencies it's made of).
- Visualizing the transform as "winding" a signal around a circle provides a powerful intuition for how it identifies the strength of different frequencies.
- A spike in a Fourier transform plot indicates that the corresponding frequency is a strong component of the original signal.
- The transform is a linear operation, meaning the transform of a sum of signals is the same as the sum of their individual transforms, making it powerful for analysis.
- This process has practical applications, such as in sound editing, where it can be used to isolate and remove specific unwanted frequencies from a recording.