SLV Calendar Spread Follow-Up: Trade Attribution Analysis
Audio Brief
Show transcript
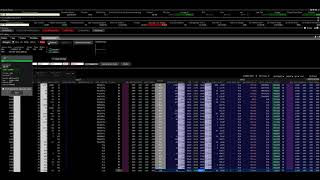
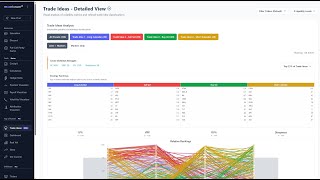
This episode demonstrates using a Greeks Attribution Visualizer to analyze the historical performance of an options trade.
There are three key takeaways from this analysis.
First, backtest options spreads by analyzing each leg individually. Second, identify the true driver of your profit or loss using Greeks attribution. Third, for volatility spreads, focus on Vega P&L as the primary factor.
Attribution tools help analyze the historical P&L of each component in complex options strategies. Understanding individual leg performance builds a complete picture of overall risk and reward for the strategy.
Breaking down a trade's performance by its Greeks is crucial for validating your thesis. This reveals if profit or loss stemmed from views on direction, volatility, or time decay.
In strategies like calendar spreads, Vega P&L is often the most significant contributor. The analysis of a reverse calendar spread in SLV highlighted Vega as the dominant factor, leading to a net profit of 50 cents.
This powerful analysis method helps traders understand trade outcomes and refine future options strategies.
Episode Overview
- This episode demonstrates how to use a "Greeks Attribution Visualizer" to analyze the historical performance of an options trade.
- The speaker deconstructs a specific reverse calendar spread idea in SLV (iShares Silver Trust) that was identified a week prior.
- He analyzes the profit and loss (P&L) for each leg of the spread, isolating the performance drivers such as realized volatility and changes in implied volatility (Vega).
- The analysis shows how the tool can be used to backtest a trade thesis and understand the financial outcome based on market movements.
Key Concepts
- Greeks Attribution Analysis: A method of decomposing an option's profit and loss into its constituent risk factors, known as the Greeks. This allows a trader to understand why a position made or lost money by isolating the P&L from changes in the underlying's price, time decay (Theta), and implied volatility (Vega).
- Delta-Hedged P&L Simulation: The tool simulates the P&L of an option position under the assumption that it was delta-hedged daily. This isolates the performance that comes from factors other than the underlying's price direction, primarily focusing on the relationship between realized volatility, time decay, and changes in implied volatility.
- Reverse Calendar Spread: The specific trade analyzed involves buying a near-term option and selling a longer-term option with the same strike price. The analysis breaks down the performance of each leg individually to determine the overall P&L of the spread.
- Vega P&L: This represents the profit or loss generated from changes in the option's implied volatility. In the demonstrated trade, Vega was the dominant factor in the P&L for both legs of the spread.
Quotes
- At 00:37 - "And I just wanted to point out, uh, just kind of show the attribution visualizer that we have to show what it, uh, how how you can use that to look at the history of a trade." - The speaker explains the primary purpose of the video is to demonstrate the practical application of the analysis tool.
- At 02:27 - "That your performance was that you would you would have lost 63 cents a contract buying the at-the-money call." - This is the conclusion after analyzing the first leg of the spread (the long January option), showing a loss based on market movements over the past week.
- At 05:50 - "So, you lost 63 cents owning the Jans, and you would have made a dollar 13 being short the Mays, so you net-net made 50 cents on the time spread." - The speaker summarizes the final P&L by combining the results from both legs of the reverse calendar spread, showing a net profit for the strategy.
Takeaways
- Backtest Spreads by Analyzing Each Leg Individually: Use attribution tools to analyze the historical P&L of each component of a complex options strategy. By understanding how each leg would have performed, you can build a more complete picture of the strategy's overall risk and potential reward.
- Identify the True Driver of Your P&L: When reviewing a trade, it's crucial to break down its performance by the Greeks. This helps determine if your profit or loss was due to your view on direction, volatility, or time decay, allowing you to validate your initial thesis and learn from the outcome.
- For Volatility Spreads, Focus on Vega: In strategies like calendar spreads, where the primary bet is on the term structure of implied volatility, the P&L from Vega is often the most significant contributor to the final result. Understanding how Vega affects each leg of the spread is key to managing the position effectively.