Morning Options Walkthrough: Oil Volatility & HOOD Earnings
Audio Brief
Show transcript
Episode Overview
- This episode demonstrates how to analyze options markets during high-volatility events, specifically focusing on geopolitical risks in Oil (USO) and upcoming earnings for Robinhood (HOOD).
- The narrative moves from identifying macro market anomalies—such as inverted term structures and extreme skew in oil—to a granular case study on decomposing earnings volatility to find "cheap" or "expensive" premiums.
- This content is highly relevant for options traders who want to learn how to mathematically separate specific event risk from general market noise to identify pricing discrepancies.
Key Concepts
-
Inverted Volatility Term Structure as a Fear Gauge
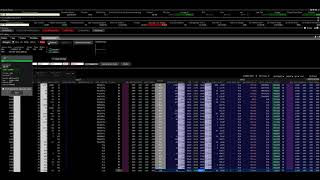
- In normal markets, longer-dated options have higher implied volatility (IV). In USO (Oil), the term structure is inverted (short-term IV is higher than long-term) and heavily skewed toward calls. This indicates the market is pricing in an immediate, violent upside risk (e.g., supply shocks from Iran/Venezuela) rather than general uncertainty.
-
Decomposing Event Volatility
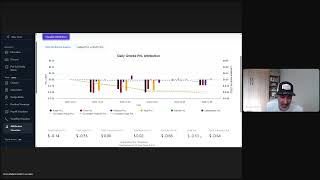
- The price of an option expiring after an earnings event contains two distinct components: the volatility of the event itself (the "jump") and the background volatility of the regular trading days before and after the event.
- To understand if an option is truly expensive, one must isolate the earnings move. If you subtract the expected earnings variance from the total variance, what remains is the implied volatility for the non-earnings days.
-
Variance is Additive, Volatility is Not
- When calculating "leftover" volatility, you cannot simply subtract percentages. You must square the volatility to get variance, subtract the event variance, and then take the square root to return to a volatility figure. This mathematical nuance is critical because small changes in the expected earnings move can drastically change the implied volatility of the remaining days.
-
The "Glide Path" of Implied Volatility
- As an expiration date approaches an earnings event, the headline IV number will naturally rise, even if the price of the straddle (the dollar cost) decays slightly due to theta. This is because the fixed event risk (e.g., a 9% move) represents a larger and larger portion of the remaining time's annualized volatility.
Quotes
-
At 8:12 - "Oil is like [a] really smart market and it's discounted the hell out of the puts already... that 25 delta put is a 20% discount to the at the money... it's so heavily discounted that I really don't like that trade anymore." - Explaining how to use skew data to avoid crowded trades; even if you are bearish, buying puts might be bad value because the market has already priced in the downside scenario.
-
At 10:05 - "How do we compare that with like a regular volatility? Because some part of the volatility there is attributed to the fact that we're going to move a bunch on February 10th." - Identifying the core problem in options pricing: distinguishing between the premium paid for a specific binary event versus the premium paid for general time duration.
-
At 15:00 - "If we take less variance for that day... instead of a 9% move, we have only an 8% move, then we have more volatility left in that straddle that needs to be divided amongst the non-earnings days." - Teaching the sensitivity of the model; if the market overestimates the earnings move, the residual days are actually priced cheaper than they appear, and vice versa.
Takeaways
-
Contextualize Skew before Directional Betting
- Before buying puts or calls on commodities like Oil, check the skew (Risk Reversal). If downside puts are trading at a massive discount to calls (as seen in USO), the market has likely already priced in your bearish thesis, making it a poor risk/reward entry.
-
Calculate the "Residual" Volatility
- When trading earnings, do not just look at the headline IV. Estimate the expected earnings move (e.g., the average of the last 8 quarters), subtract that specific variance from the expiration's total variance, and analyze the "residual" volatility. If the remaining volatility is significantly lower than the stock's realized volatility, the straddle might be cheap.
-
Run Sensitivity Analysis on Earnings Moves
- Use a spreadsheet or calculator to test different earnings move percentages (e.g., 6% vs 9%). Determine what the "break-even" earnings move is that aligns the residual volatility with the stock's normal trading behavior. If the market requires an unrealistic earnings move to justify the current option price, you have identified a tradeable edge.