May 18, 2026 - Featuring VolumeLeaders - Market Moves with Volland
Audio Brief
Show transcript
This episode covers how to use advanced options market positioning, specifically vanna and skew data, to predict broader market movements and pinpoint potential reversals. There are three key takeaways for active investors. First, volume spikes in volatility products signal impending market turns. Second, positional skew anomalies expose mispriced options, and third, dealer hedging flows create mechanical price boundaries.
Expanding on the first takeaway, massive trading volume in volatility exchange traded notes at market highs frequently signals an unwinding of institutional long positions. When large players close these volatility positions, it typically precedes a decline in market anxiety and signals a broader shift. Monitoring these volume spikes provides a highly reliable indicator for upcoming trend reversals.
Regarding the second takeaway, investors must closely watch for discrepancies between positional skew and market skew. When a heavily rallied stock shows an inverted skew where option forwards are priced below the current spot price, it signals a major conflict between dealer expectations and general market sentiment. Market skew eventually converges with positional skew, making this pricing anomaly a strong warning sign of a downward correction.
On the final takeaway, large options trades concentrated at specific price levels act as heavy support or resistance due to dealer hedging mechanics. As an underlying stock moves toward large option strike prices, dealers must continuously buy or sell the stock to remain delta neutral. This gamma feedback loop can severely dampen price movements or artificially amplify them, independently driving behavior in decoupled sectors like semiconductors.
By understanding how institutional options flow dictates underlying stock behavior, traders can move beyond basic price charts to successfully anticipate the next market move.
Episode Overview
- Explores how to use advanced options market positioning, particularly vanna and skew data, to predict broader market movements and pinpoint potential reversals.
- Analyzes specific sectors and stocks, including the decoupling of the semiconductor sector and deep-dives into the options setups for Micron (MU), AMD, Intel, and SAP.
- Explains the mechanics behind dealer hedging, gamma feedback loops, and how discrepancies between positional skew and market skew create actionable trading environments.
- Highly relevant for active traders and investors who want to move beyond basic price charts and understand how institutional options flow dictates underlying stock behavior.
Key Concepts
- Options Market Positioning and Vanna: Large options trades concentrated at specific price levels act as heavy support or resistance. Vanna plays a critical role: if vanna is positive, falling implied volatility forces options dealers to buy the underlying stock (supporting the price), whereas rising volatility forces them to sell (acting as resistance).
- Gamma Feedback Loops: As an underlying stock's price moves toward large option strike prices, the delta of those options changes. Dealers must continuously buy or sell the underlying stock to remain delta-neutral, a process that can severely dampen price movements (creating resistance) or artificially amplify them.
- Positional vs. Market Skew Anomalies: Often, the market's implied volatility skew differs from the skew implied strictly by options positioning. When positional skew significantly diverges from market skew (e.g., an inverted skew where forwards are priced below the current spot price despite a recent rally), it signals a strong conflict between dealer expectations and market sentiment.
- Volatility ETNs as Reversal Indicators: While ETNs like UVIX and SVIX aren't pure volatility, massive trading volume spikes in these products at market highs frequently signal the unwinding of long volatility positions, often preceding a decline in volatility and a market shift.
- Sector Decoupling: Certain sectors, notably semiconductors, are currently behaving independently of traditional macroeconomic drivers like oil prices or geopolitical stress, entirely driven instead by their own extreme options market concentration.
Quotes
- At 5:46 - "so when we get a big volatility spike one of the indicators one of the things we all look for and watch for is that big large uh uvix or uvxy trade at the spike high which generally indicates they're unwinding their long volatility positions and we should see it decline" - Explains how to interpret large block trades in volatility ETNs as a reliable signal of an impending trend reversal.
- At 8:13 - "I think the end of May is when the market's going to lose patience with the whole Hormuz thing and opens the door for a sell off." - Highlights the intersection of options expiration timing and overarching geopolitical risk.
- At 15:52 - "This is a uh sort of a longer-term view and you can see a concentration of top 10 rank trades up here which is in some ways reflected uh or influenced by the sheer price..." - Illustrates how visualizing trade concentration charts helps identify major upcoming price levels of interest.
- At 19:51 - "So the option forward, which is the lowest implied volatility area, is down at 713. So that is the opposite of what is normal. Normally stocks, stock forwards are above price, especially if the price moved up as fast as it did, right?" - Highlights a critical abnormality in Micron's pricing, showing how options can predict a pessimistic outlook despite a rapid stock rally.
- At 22:29 - "The yellow is what the skew curve would look like if it was solely based on option positioning. And a lot of times blue converges with yellow as opposed to the other way around." - Clarifies a technical rule of thumb: market skew eventually adjusts to align with the underlying options positioning.
- At 29:51 - "That creates a kind of a gamma feedback loop where dealers have, let's say a 30 delta call and they're long, right? They have shorted that, so there's, there are 30 shares short, okay? As the price gets closer to that 30 delta call, that delta goes up to like 40. And then in order to hedge that 40 delta call, they have to sell 10." - Provides a clear explanation of how dealer gamma hedging creates mechanical resistance levels in the market.
Takeaways
- Track volume spikes in volatility ETNs (like UVIX or UVXY) at market peaks to anticipate when institutions are unwinding long volatility positions, signaling a potential market turn.
- Monitor heavily rallied stocks (like MU) for inverted skew—where option forwards are priced below the current spot price—as a warning sign to prepare for a downward correction.
- Compare positional skew against market skew to identify mispriced options; buy options where positional skew is higher than market skew, and sell where it is lower.
- Factor dealer hedging flows into your support and resistance levels by identifying large concentrations of options strikes, recognizing that dealers will be forced to buy or sell to remain delta-neutral as prices approach those levels.
More from Wizard of Ops - Options and Volatility Trading
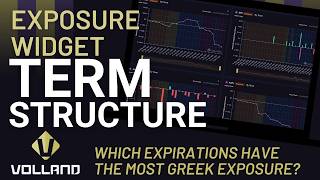
Term Structure Exposure on Volland - Identify Option Expirations with Profound Imbalance
May 18, 2026
May 18, 2026 - Featuring VolumeLeaders - Market Moves with Volland 📱
May 18, 2026

May 11, 2026 - Market Moves with Volland: Dealer Positioning & Trade Strategies 📱
May 10, 2026

May 11, 2026 - Market Moves with Volland: Dealer Positioning & Trade Strategies
May 10, 2026